![[JT]](https://www.jochentopf.com/img/jtlogo.svg) Jochen Topf's Blog
Jochen Topf's Blog
Recently I was working on some OSM software when I noticed a strange thing…
Before I can tell you about the strange thing, I have to get you some background about how OSM stores node locations: Each node has a longitude and a latitude. Internally they are stored as 32bit integers containing 10,000,000 times the real coordinate. So 49.2405632° ist stored as 492405632. The resolution is fixed, differences below 1cm or so (depends on where the coordinate is in the world) can not be resolved. For the purposes of OSM this is plenty. And it saves memory compared to the 64bit storage normally needed for a floating point number (double).
I was working on a program that was using the lower bits in those integer coordinates (for what doesn’t matter for my story here). You would expect the distribution of the lower bits to be random, so there should be an about equal amount of zeros and ones in the lowest bit — the one that decides whether a number is even (0) or odd (1). But that wasn’t the case. Looking at the longitude or latitude in all the nodes of the planet file the number of zeros is about 50% bigger than the number of ones!
There is a pretty simple and obvious explanation for this: If you edit data randomly you should have an even distribution, but if you import your data from somewhere with a lower resolution or if somebody rounds the data somewhere in transit, you get more zeros. What what is it? Is it a particular import? Or is some editor rounding of the numbers?
To find out more, I first wrote a little program (using Osmium, of course) that reads a planet file and writes out four OSM files containing the nodes with lower bits 0 and 1 respectively for both longitude (x) and latitude (y). Just looking at the file sizes, you can already see a large difference:
| 8822246286 | nodes_x0y0.osm.pbf |
| 5489745769 | nodes_x0y1.osm.pbf |
| 5500774190 | nodes_x1y0.osm.pbf |
| 5489986398 | nodes_x1y1.osm.pbf |
One suspicion I had immediately was that the TIGER import had something to do with this. So with this little script I checked for all nodes with tags containing the word ‘tiger’:
for i in nodes_x*; do
    echo -n "$i: "
    osmium cat $i -f opl | grep ' v1 ' | \
        cut -d' ' -f 8 | grep tiger | wc -l
done
This converts the files I have just generated into OPL format (again, using Osmium, this time the command line tool), filters out only objects having version 1 and checks for ‘tiger’ somewhere in the tags and counts the results. This was the result:
| 6846 | nodes_x0y0.osm.pbf |
| 1316 | nodes_x0y1.osm.pbf |
| 1217 | nodes_x1y0.osm.pbf |
| 1252 | nodes_x1y1.osm.pbf |
A difference between x0y0 and the others is a strong indication that the TIGER import is involved. But the absolute numbers are quite low, because of the node tag TIGER fixup which obscures the results. At this point I could have gone to the history files, but I tried a different approach…
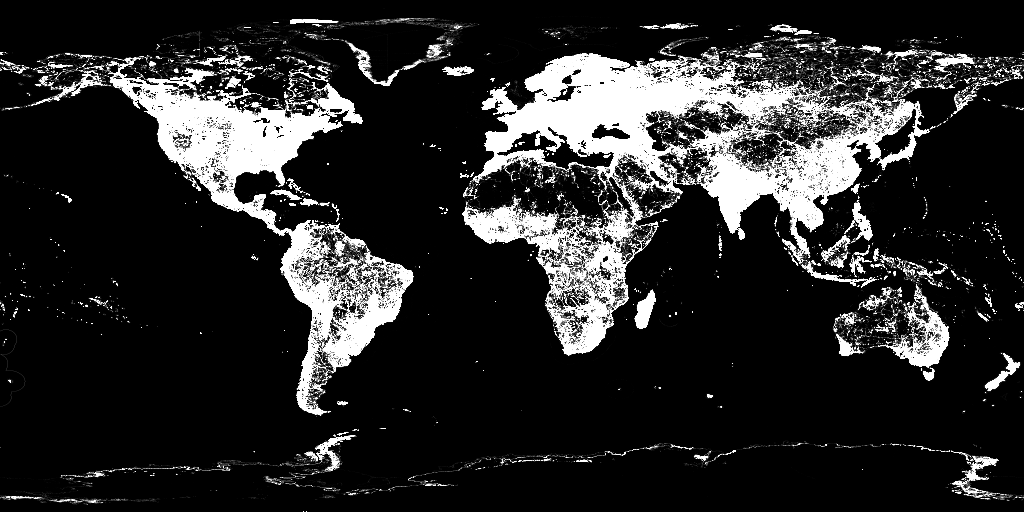
Using (the Osmium-based — are you detecting a pattern here?) node_density tool I plotted where all those nodes are. I tried different parameters and here are two examples of the results for the x0y0 case:

(Click on the images to get a larger version)
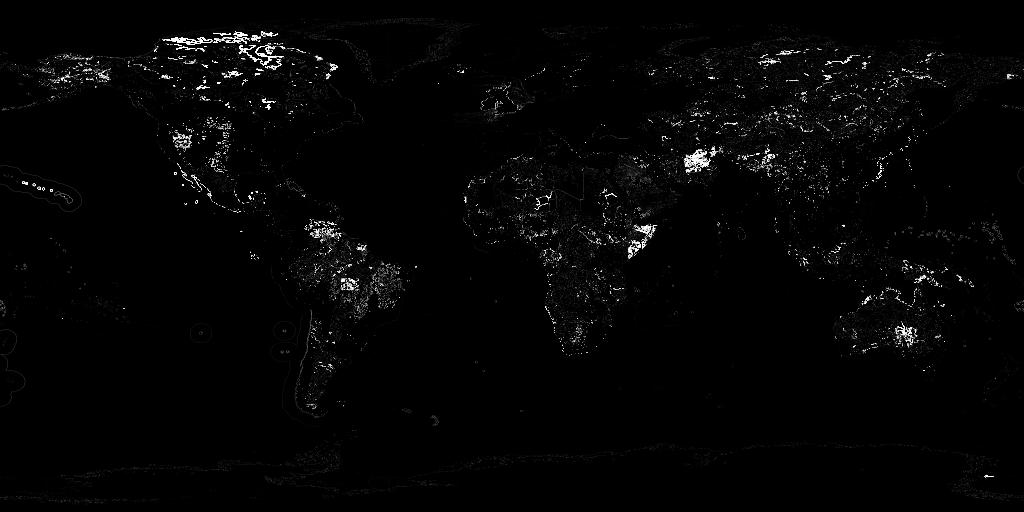
And this is the x1y1 case:
(The x0y1 and x1y0 case are very similar to the x1y1 case, so I have ignored them here.)
If you look closely, you can see some differences. To make them clearer, I used ImageMagick to calculate the difference between those two images. Here are the results:
You can see the coastline in northern Canada, a rectangular region in the Amazon basin where water data was imported, and other “clumps” of nodes.
With different parameters for the image creation I got his picture better showing the differences in the areas where nodes are dense:

As you can clearly see this shows the anomalies in the US, eastern Europe and Japan.
In a very different approach I looked at the users who last touched those nodes. For the x1y1 case the top ten editors are:
| 11791183 | CanvecImports |
| 7623451 | jumbanho |
| 6708925 | nmixter |
| 6155778 | 3dShapes |
| 5439717 | NLCanvec |
| 3984250 | jremillard-massgis |
| 3564654 | katpatuka |
| 3532303 | azub |
| 3270347 | bgamberg |
| 2939181 | Petr1868 |
The results for the x1y0 and x0y1 case are very similar. But the x0y0 case is very different:
| 134306585 | woodpeck_fixbot |
| 22838813 | jumbanho |
| 17992974 | Tom_G3X |
| 11896685 | CanvecImports |
| 10092244 | ËdzëronK |
| 8561785 | ikiya |
| 8117431 | yamasan |
| 7962903 | Petr1868 |
| 7191484 | Liber |
| 7109647 | katpatuka |
Most of the users in this list are only in the top ten in this file: woodpeck_fixbot (map), Tom_G3X (map), ËdzëronK (map), ikiya (map), yamasan (map), and Liber (map).
woodpeck_fixbot was used to fix up nodes from the TIGER import, so that is easy to explain. Liber probably did a different import in the US, you can see the bulk_upload.py mentioned as his favourite “editor” on his HDYC page. Tom_3GX, ikiya, and yamasan are very active mappers in Japan, but it is not clear where the bias towards the zero comes from in this case. The same goes for ËdzëronK who is mostly mapping in France.
I’d love to dig deeper, but that shall be enough for today…
Tags: openstreetmap