![[JT]](https://www.jochentopf.com/img/jtlogo.svg) Jochen Topf's Blog
Jochen Topf's Blog
Most maps need little symbols and labels for settlements like cities and towns. Of course you can’t put all settlements on the map, so you have to select those you want to show. For that you need to “rate” the places in some way, so that you can show only the more important ones. And then you want to show a “reasonable” selection of places, not too many so the map isn’t too crowded, not too few to make the map look empty.
(This post is part of a series about generalization of OSM data.)
The first importance criteria which comes to mind is the number of people living in a place or maybe the geographical size. All other things being equal a “larger” settlement is probably more important. But other criteria can go into this, too. If the city is a capital of a country or state it might feel more important. Or maybe it is small but a huge tourist hot spot or famous for some other reason.
Using the population numbers seems to be easy, but in OSM only some of the places have them tagged. There is also the problem of who is counting what. The City of London is only a rather tiny part of what we normally refer to as “London”. For the dot and label on the map, the population numbers of all of London (or maybe Greater London) would be a better fit, so we have to make sure that’s what’s in the data we use.
For my purposes here I am going with a different metric. I am using a dataset prepared for the Nominatim geocoder which has similar, but somewhat different, needs. If you search for “Paris” it needs to know that you probably meant the French capital and not Paris in Texas, so it can order search results accordingly. For that importance decision it uses (I am simplifying a bit here) the number of links to the corresponding Wikipedia articles as proxies for importance. Not perfect of course, but it gives us a not unreasonable number to work with.
The Nominatim dataset can be downloaded as PostgreSQL dump from the Nominatim website. Crucially for us it contains a table with the Wikidata codes and a corresponding importance rating. About 400.000 of the 1.5 million objects tagged in OSM as place=city/town/village have a wikidata tag and so can easily be matched with this.
Of course there are other metrics we could have used and everything I write about below would work in a similar fashion with a different metric. The algorithm isn’t bound to settlements either, you can use the same logic to decide which mountain peaks to show on the map based on their height for instance.
Now we need to decide which places to show on the map. The simplest, and probably most often used approach simply shows everything above a certain importance threshold. You have to set that threshold to some suitable value for every zoom level.
But this approach has a problem. The population density in the world is different everywhere. So in densly populated parts of Europe or China there will be lots of dots on the map while Australia is mostly empty.
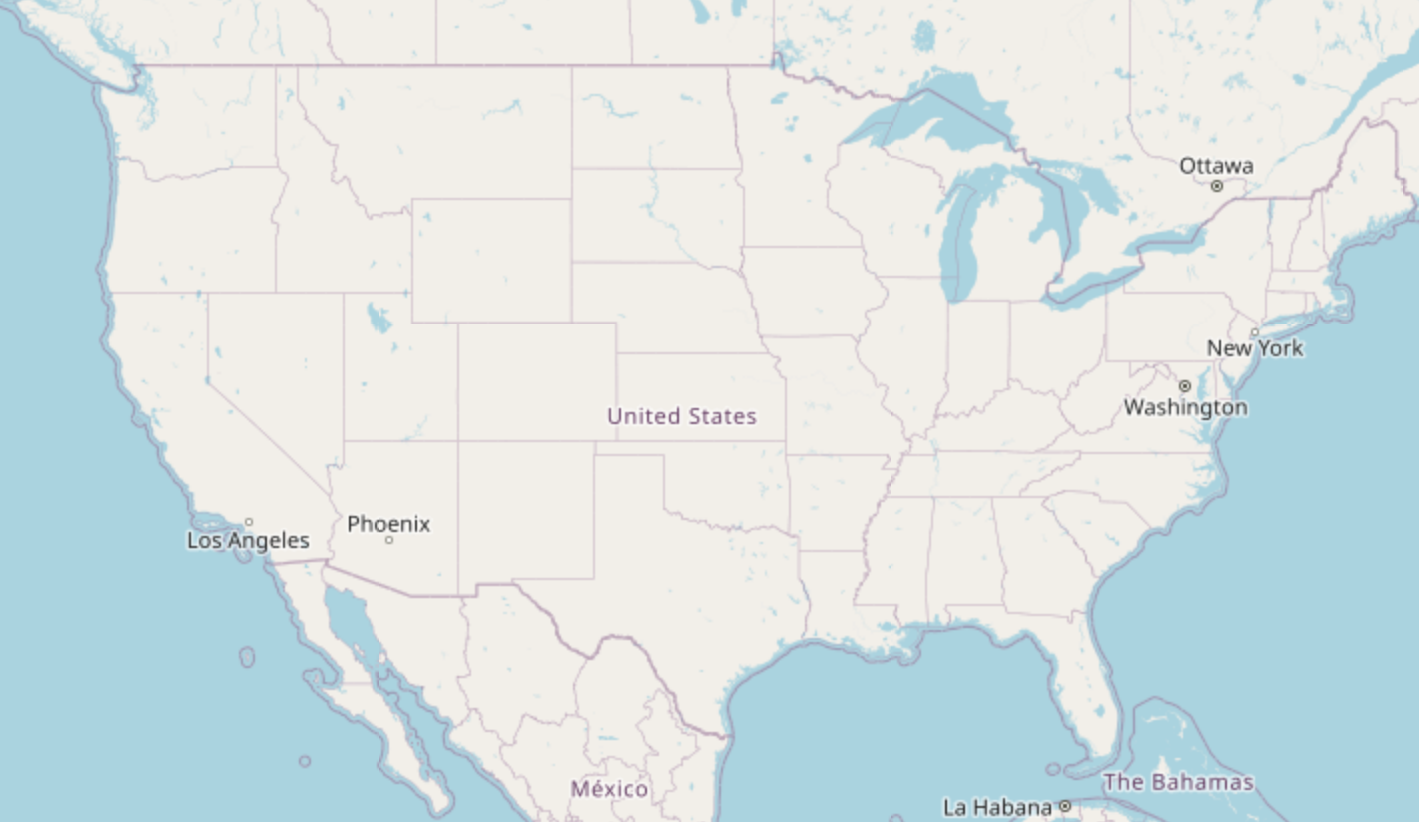
The United States on the Carto OSM map in zoom level 4 is mostly empty. The choice of places is not great.
We’d prefer to show only the most important places where they are closely spaced, and show somewhat less important places in otherwise “empty” areas.
Several algorithms have been proposed and used over the years to help with deciding what to show on a map. The paper Scale-Dependent Point Selection Methods for Web Maps by Mathias Gröbe and Dirk Burghardt gives a nice overview and proposes a new algorithm called “Discrete Isolation”. For every place it finds the nearest place with higher importance. The farther something is away from more important places, the more (visually) important it becomes itself.
The algorithm itself is rather simple (SQL code by Mathias Gröbe), but it is somewhat expensive to run, because of its O(n²) complexity. We essentially have to calculate the distance of every point on the map to every other point. If we look at an isolated map, we have to do this calculation only for those places which could possibly show up on that particular map. But if we are thinking about a tiled map, it is probably better to do this once for everything to get some consistency between tiles.
Calculating this distance matrix for the about 400.000 settlements we have an importance value for from the OSM data takes a long time if we write this as an SQL query. There are ways to speed this up splitting the data into regions, but before writing a complex piece of code it is always good to try the simpler brute force approach first. I implemented the algorithm in C++ and could run this for the whole planet in something like 2.5 minutes on my notebook. About a third of that time is spent just writing the results back to the database. At that point it doesn’t make much sense to speed it up any more, we can always do that later if needed. It is plenty fast enough to run this once a day or so, and the underlying data doesn’t change that often (or that radically) that this would be a problem.
The result of running this algorithm on Australia shows the quite regular filling of the space by the algorithm regardless of the absolute importance of the places:
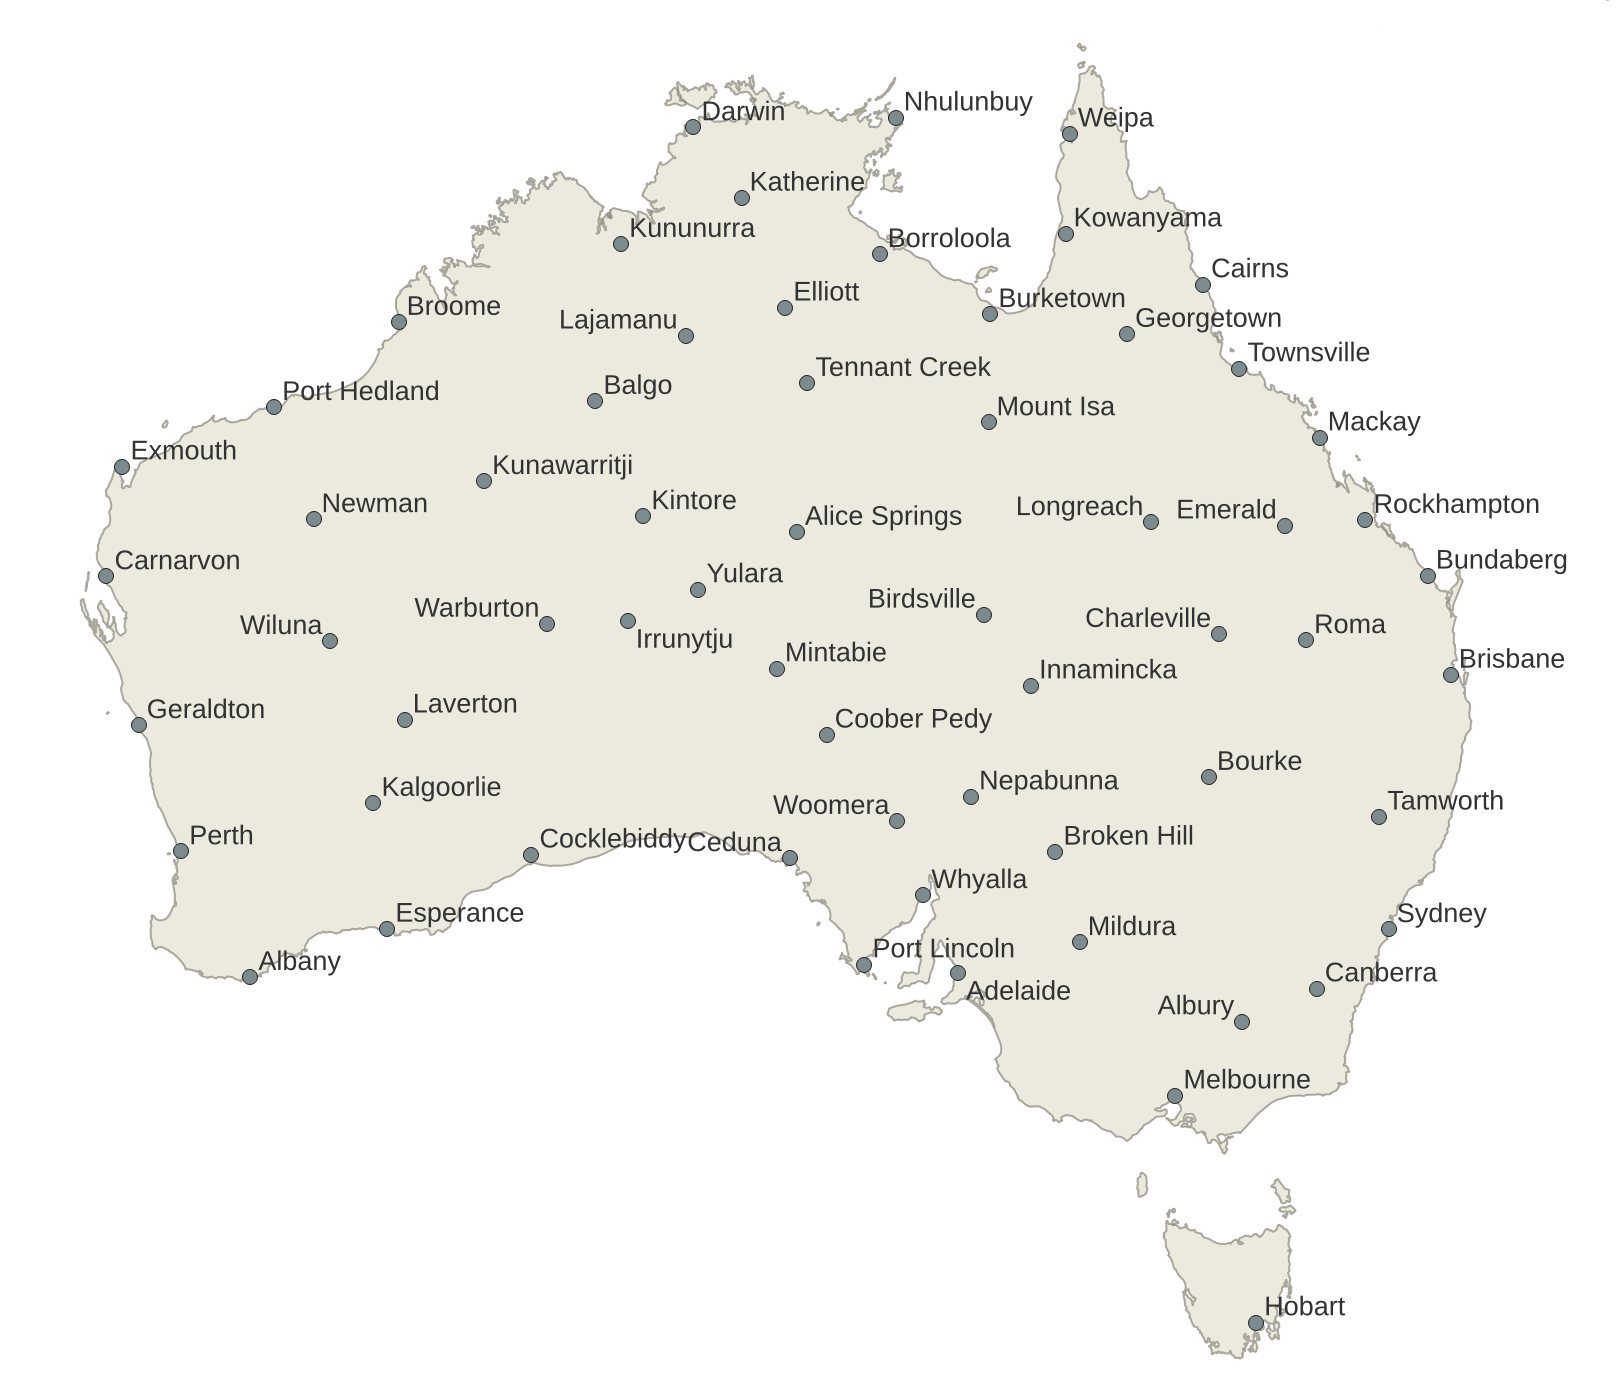
(Click on the map to see a large version.)
We can remedy this potential problem by limiting what we are showing. We use the “local” measure of the Discrete Isolation together with the “global” measure of the importance. So we show only those places that have a “high enough” value for the discrete isolation and also have a “high enough” overall importance.
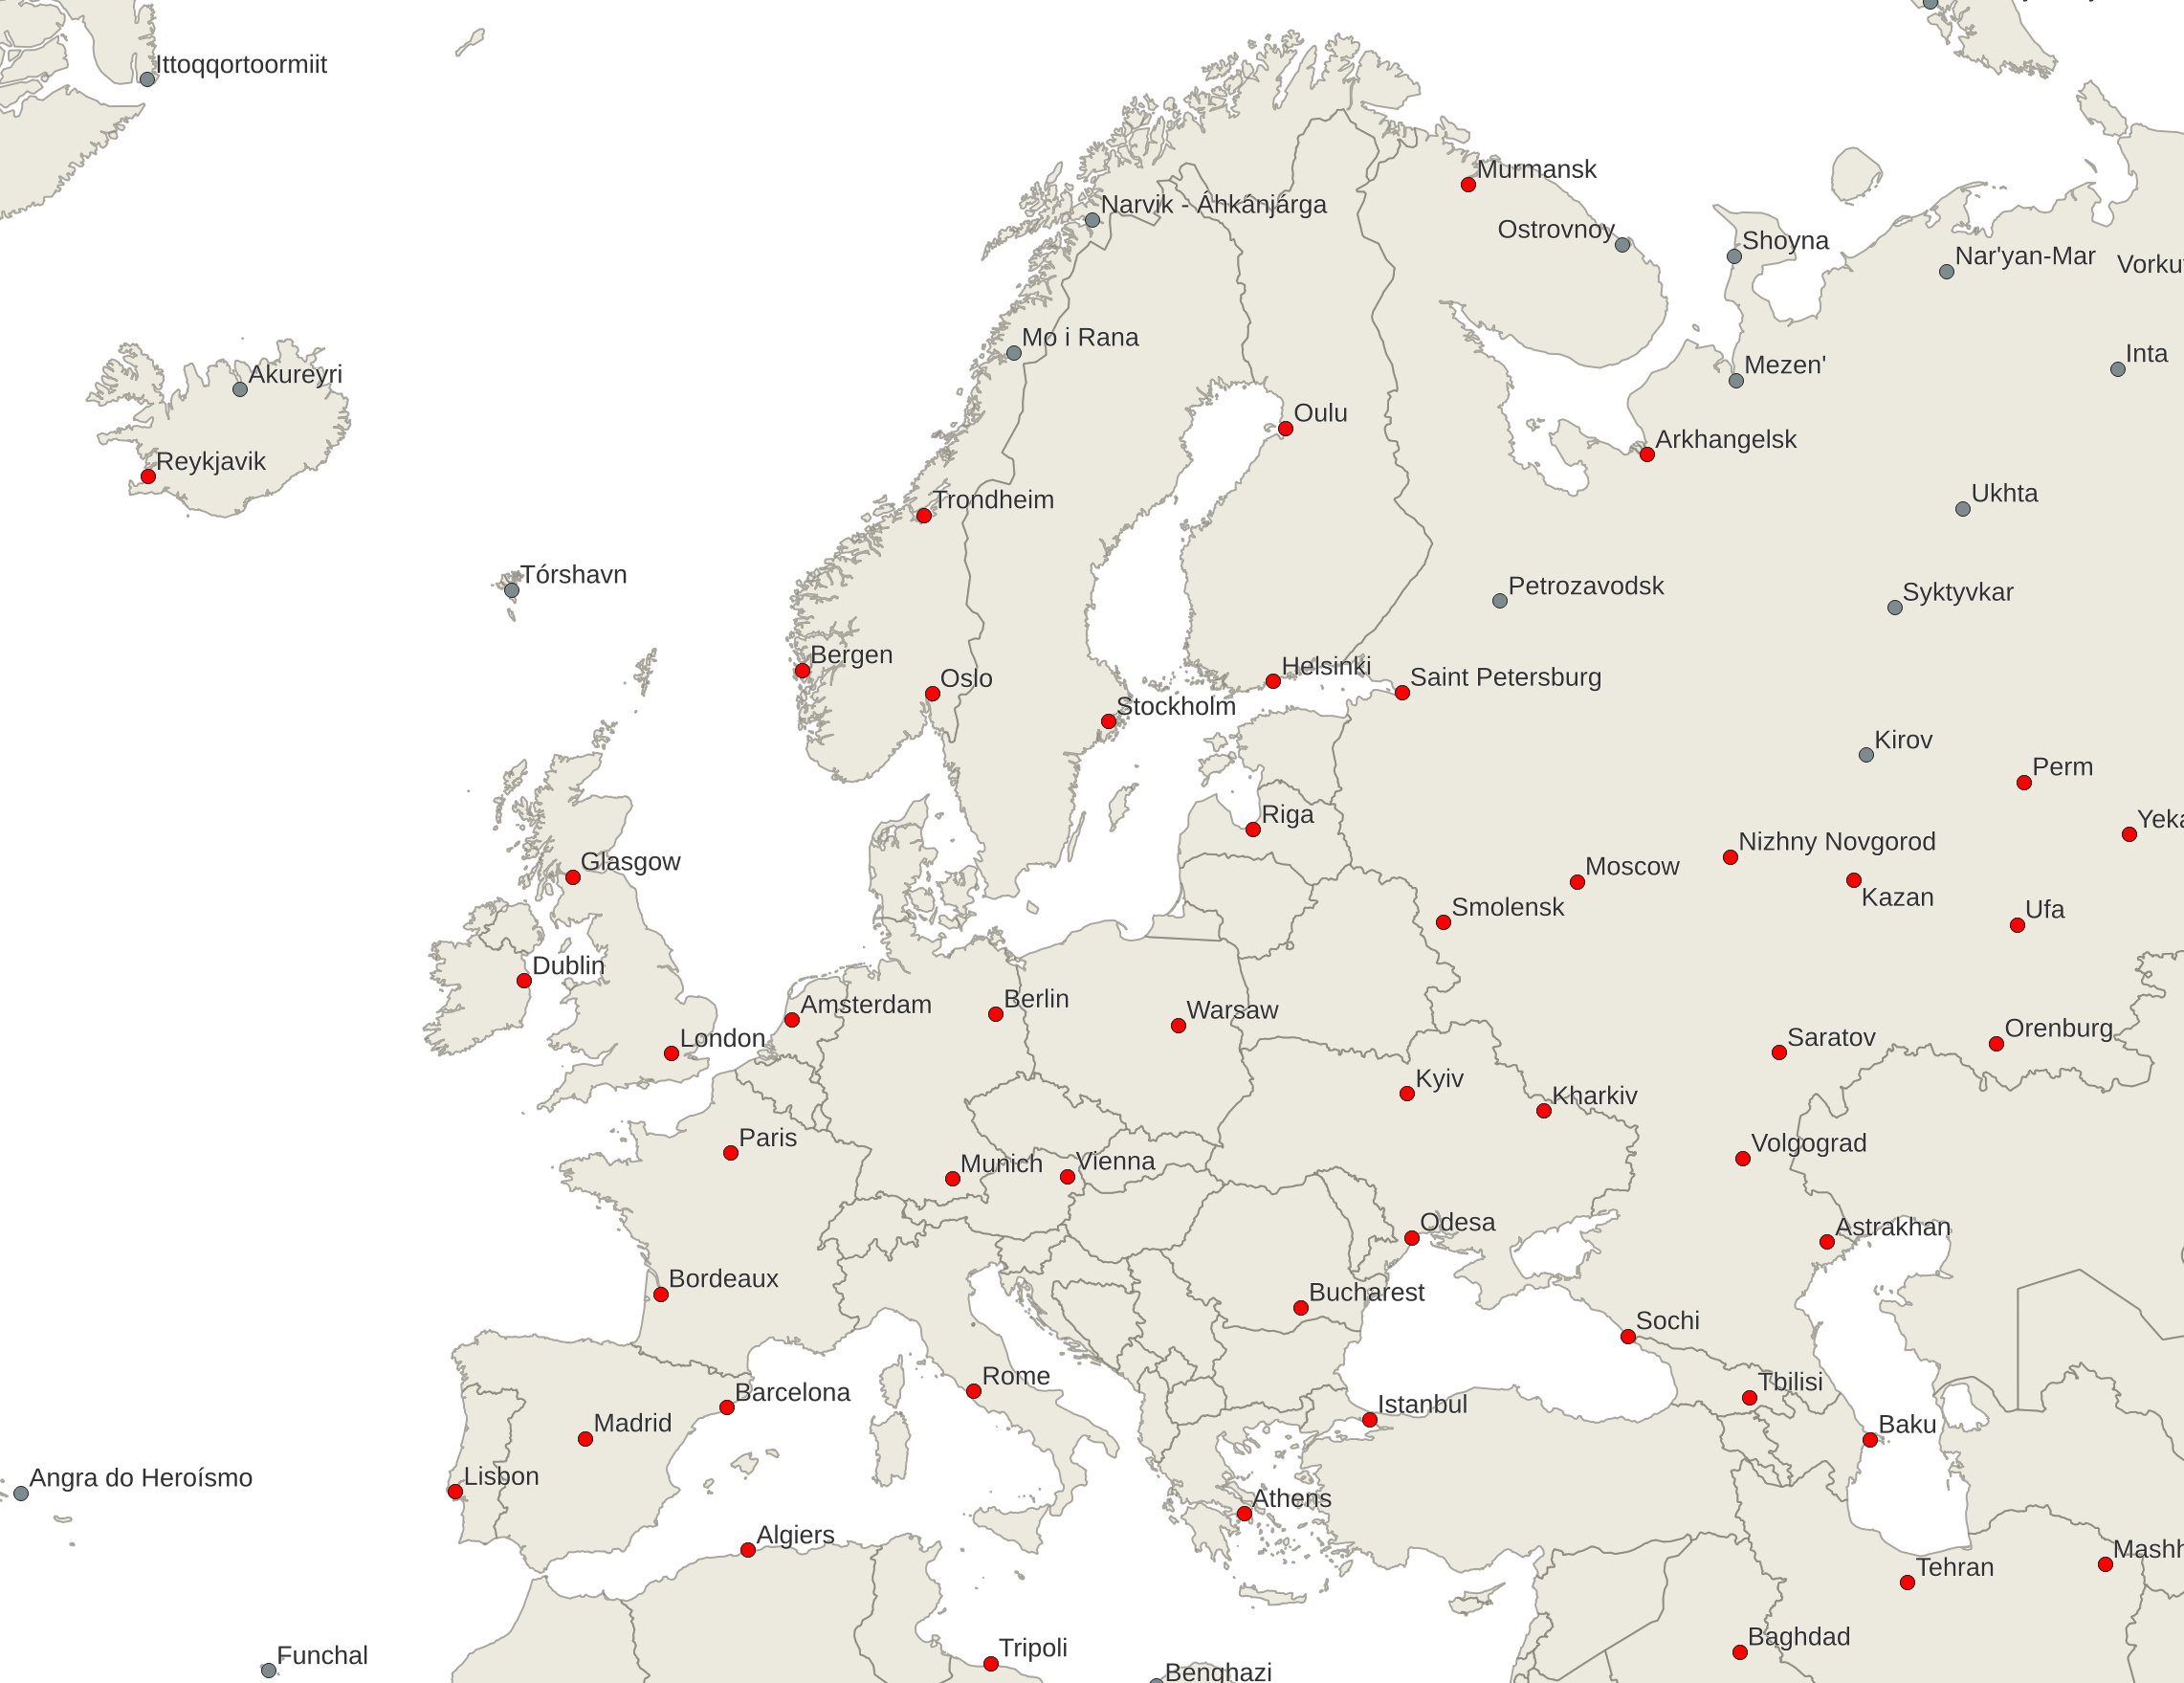
In this map of Europe you can see all the places picked by the discrete isolation algorithm. The more important ones are shown as red dots. (Click on the map to see a large version.)
To be independent of the specific numbers that our importance metric uses and the actual distance numbers generated by the Discrete Isolation algorithm I am not using those numbers directly but generate a ranking by ordering the places by important and discrete isolation, respectively and then rank them in that order.
For the map above I used the formula "discr_iso_rank < (3.5 ^ @zoom_level) * 10 and importance_rank < (10 ^ @zoom_level)" to decide which places to show and which not to show. Of course, that’s only an example and it has to be tuned for different types of maps etc.
For larger zoom levels this will not work any more at some point, because not all places in OSM have an associated importance in this case. But at some point we probably want to show all places anyway. And if we find a better importance metric this can always be extended. For higher zoom levels the number of places to consider will be much smaller, so we can try running the algorithm in real time when the tile is requested. We’ll loose some overall consistency between different places in the world but that might actually be better. Further experiments are needed in that area.
Tags: generalization · openstreetmap